Google Ads Reporting
The Reporting Tab includes a specific report on your Google Ads data. You can view your ad data here if you’ve integrated a Google Account and are using Google ads.
Step 1: Accessing The Report
- Navigate to the Reporting section of NicheFit.
- From the Google Ads dropdown menu, choose what report data you wish to view.

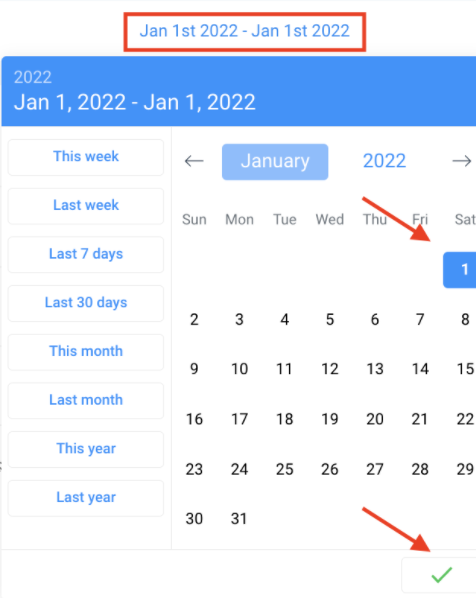
- Choose your desired date period in the top right corner of the screen.

- Click the checkbox to confirm the date period and run data for the selected period.
Step 2: Viewing The Report Data
- There are several statistics and data points available in this report.
- NOTE: The reports for Campaigns, Ad Groups, Ads, and Keywords all look almost identical. The Conversions report looks slightly different (scroll below).
- Campaigns, Ad Groups, Ads, and Keywords
- First, you can view graphs for TimeLine Clicks and Clicks per.
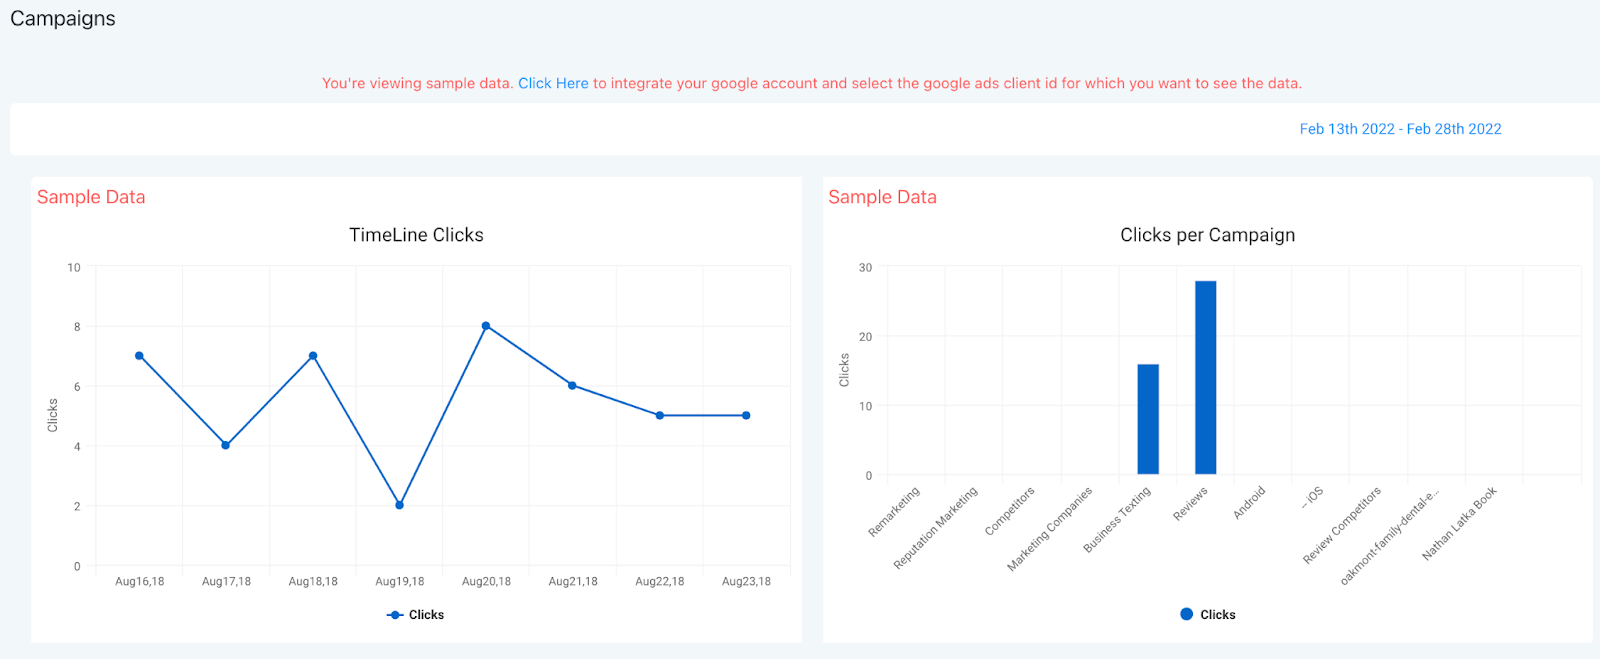
- Next, you can review clicks, impressions, cost per conversion, conversion rate, and more statistics.
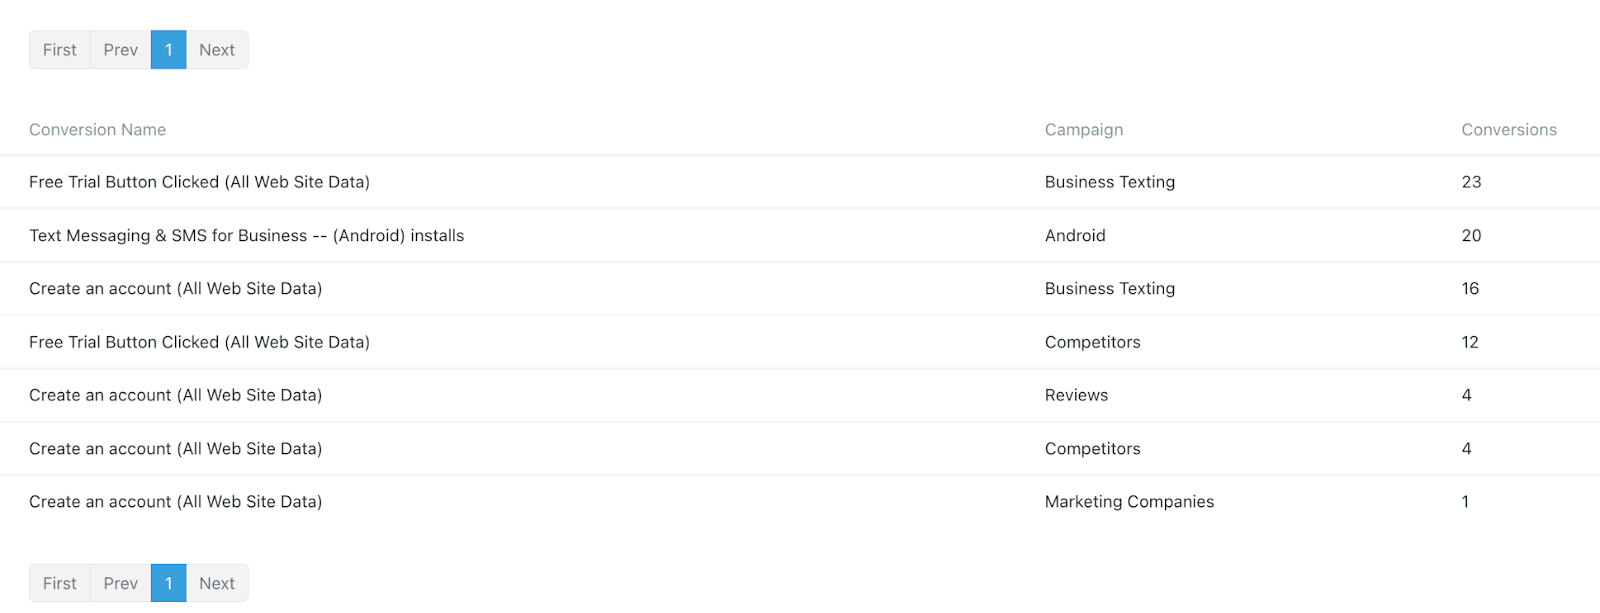
- In the bottom section, you can view a list of the data:

- Conversions
- Select an option from the dropdown for which you wish to view Conversion data: Campaigns, Ad Groups, Ads, or Keywords.
- You’ll see a graph for TimeLine Conversions and a pie chart for Conversions by Name.
- Below, you’ll see the total number of conversions.

- Below that, you can view a list of your Conversions.
Check back anytime and refresh the data to check out any period you wish to see the most updated information and statistics.
NOTE: If you wish to view reporting metrics for one day, check that date as the start and end date. You must have both selected for the stats to appear. The example below shows how you can run reporting for January 1st, 2022 by choosing January 1st as the start and end date: